|
My son and I did these experiments based
on the one found at this site http://landshape.org/enm/science-experiment-at-home-to-disprove-global-warming-theory/. If you have any questions, comments, or constructive criticisms, you can e-mail us
at tnn93w@hotmail.com. If you do e-mail us, please indicate that it is about
the experiment in the subject line. We are not scientist; we just did the experiments
to see if we could get the same results. Thanks to jae for suggesting we post
our results and thank to the administrator of the site for sharing the experiment with us! You'll find graphs and data
table below.
|
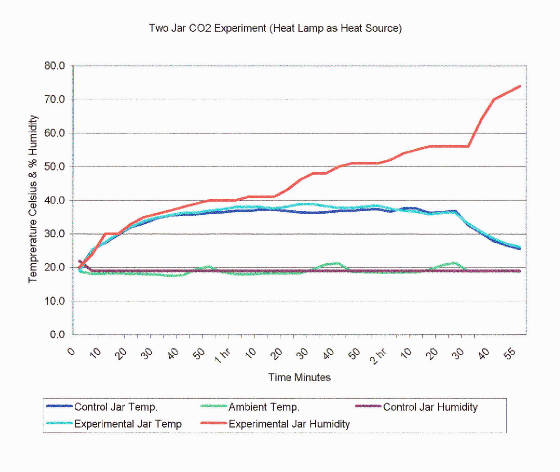
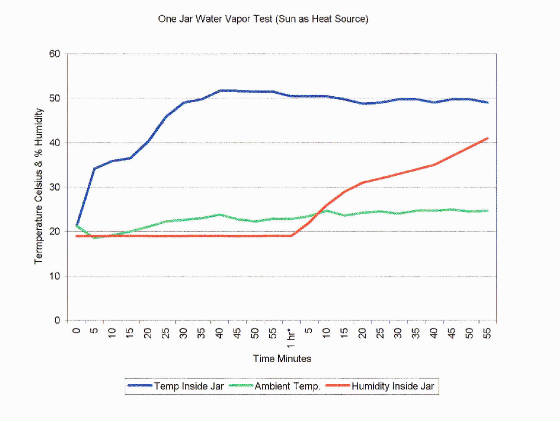
We had some clouds about 55 min. into this one
and the sun started to go down. We got the water vapor from a wet wash cloth and a shot glass of water
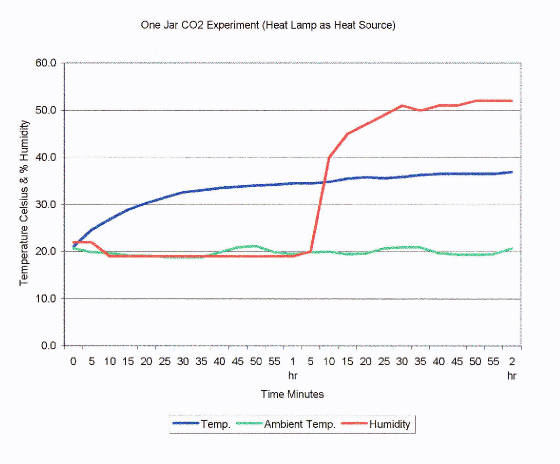
We added more CO2 about an 1hr, 15min. into this one. We truned the heat lamp off about 2hr30 mins.
We got the CO2 from 1 tsp of baking soda and 2 tbsp vinegar
|
|
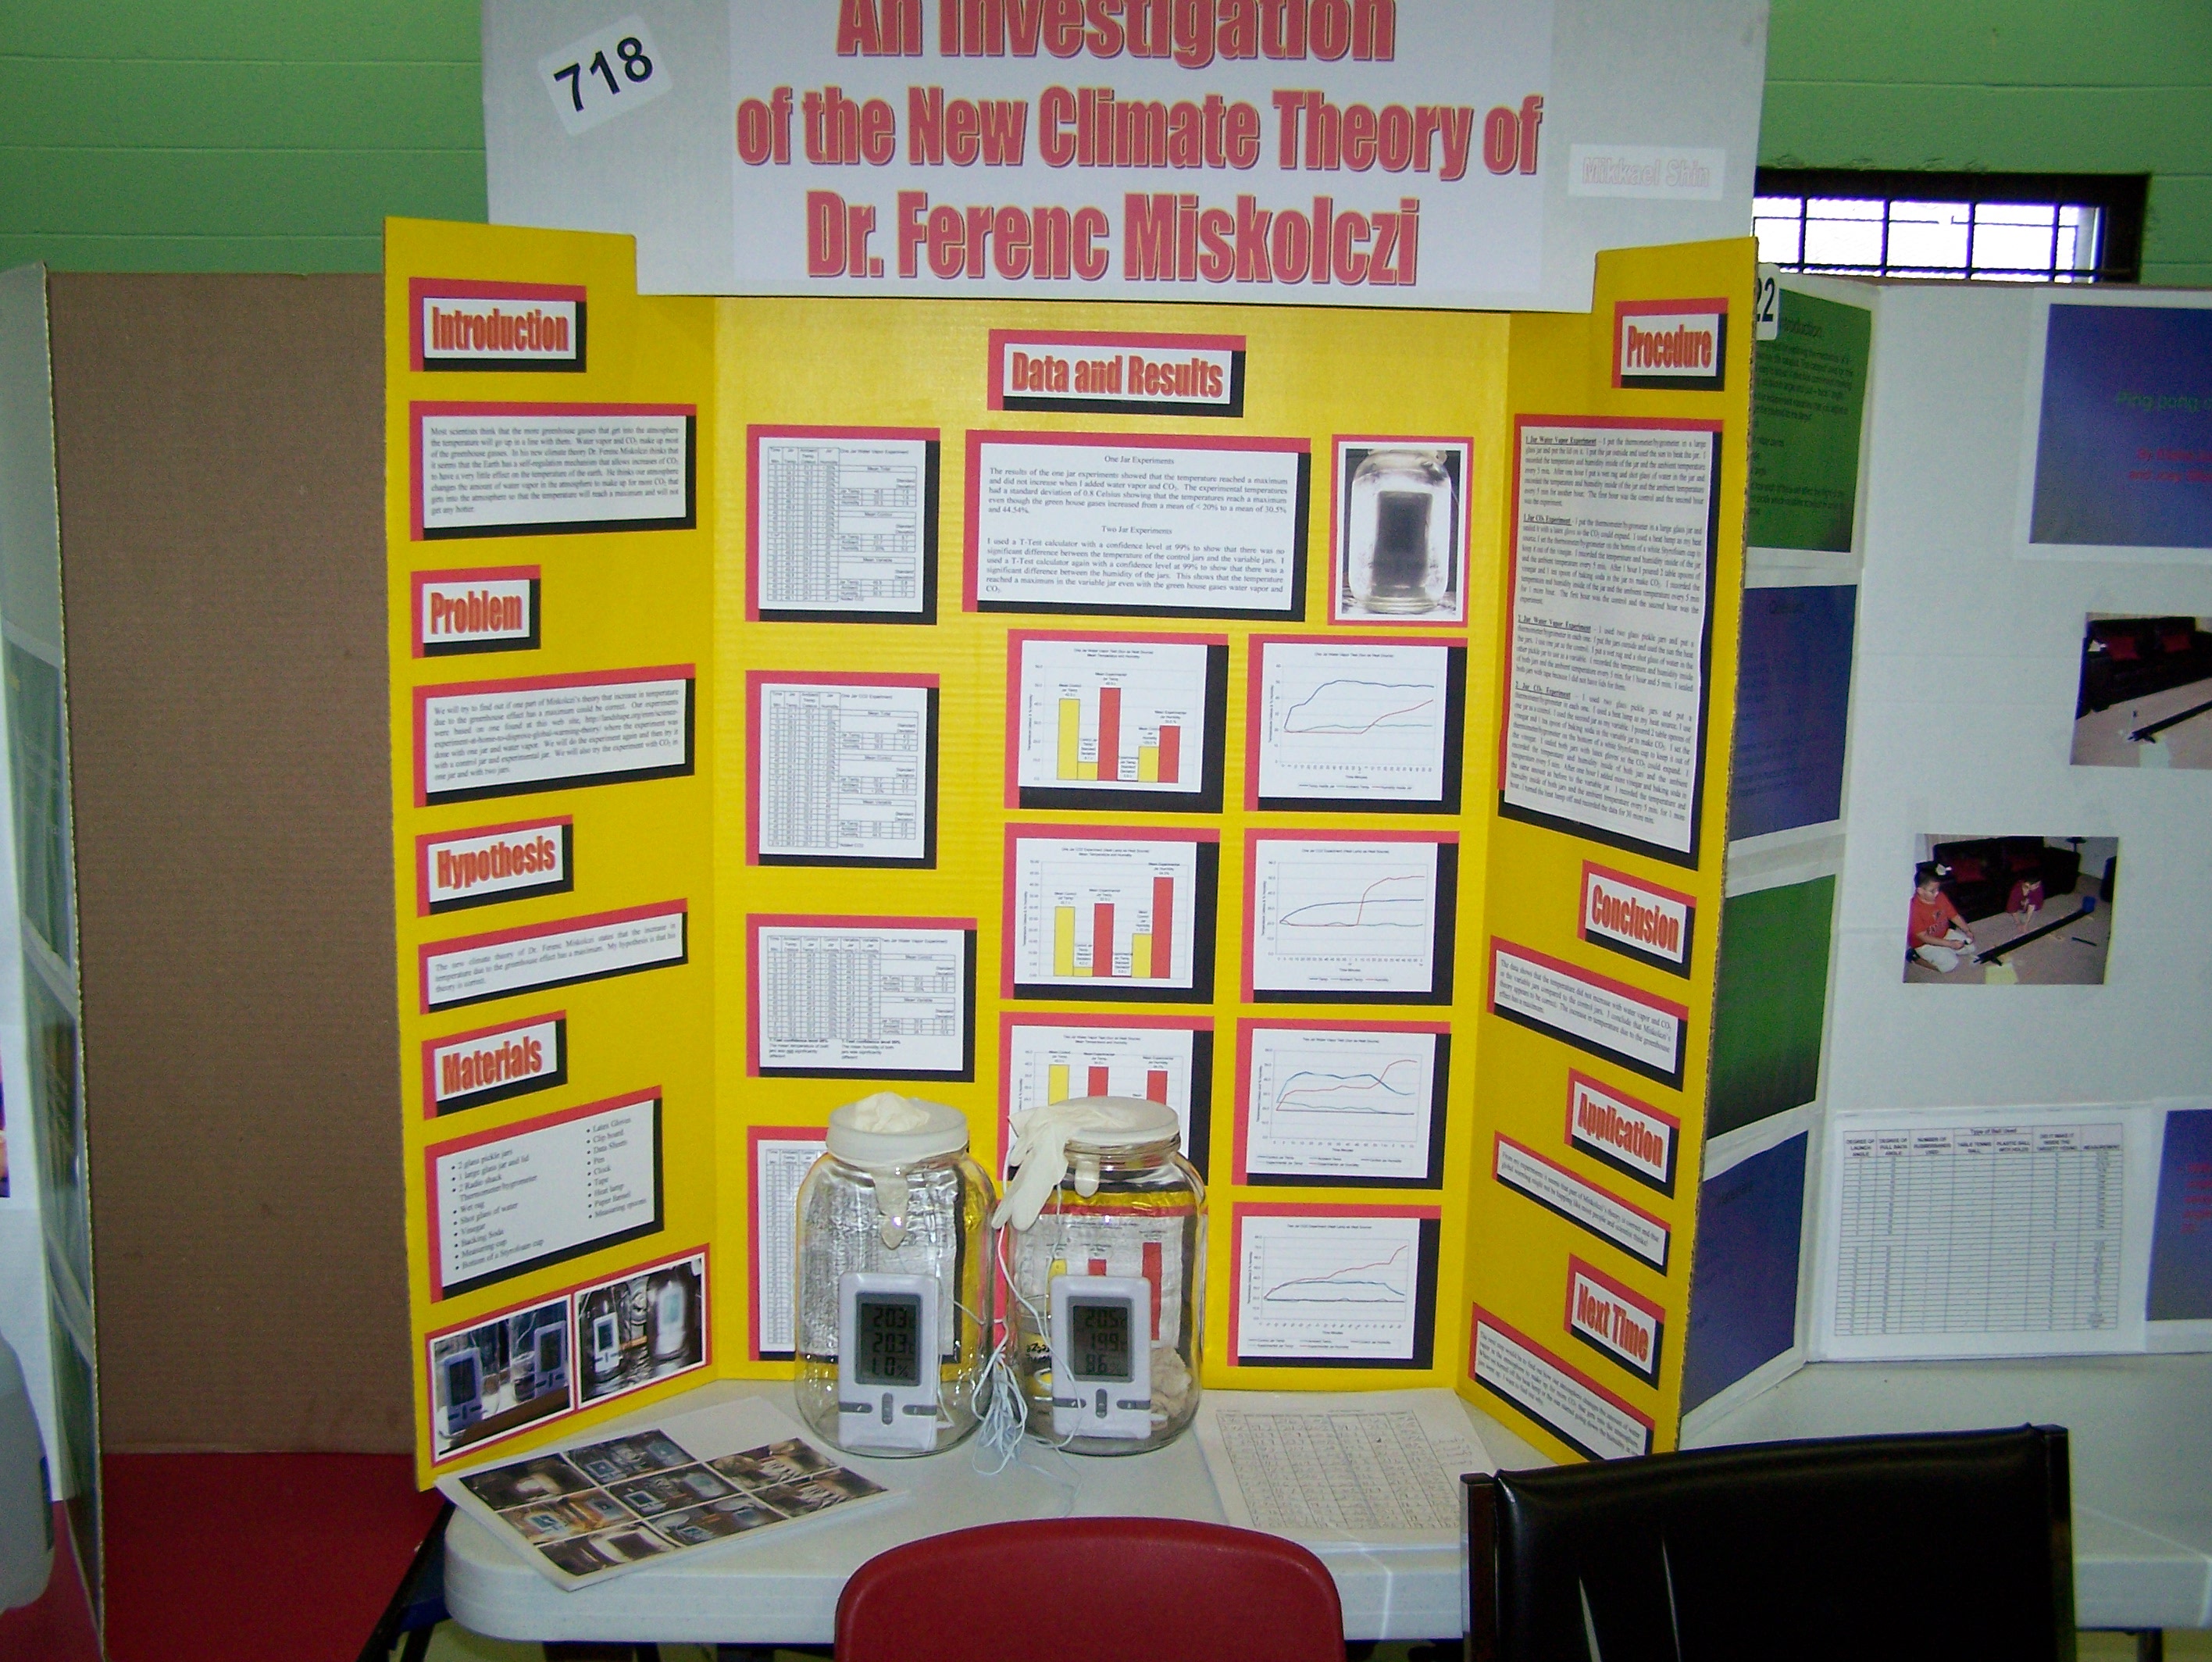
We used one very large glass jar for the one jar
experiments and used two large pickle jars for the two jar experiments. We used
Radio Shack Thermometers/hygrometers and recorded the data every 5min. The hygrometer did not measure humidity below
20%. We gave a value of 19% for humidtiy < 20%.
|
|
| |
|
|
|
|
|
|
| Time |
Jar |
Ambient |
Jar |
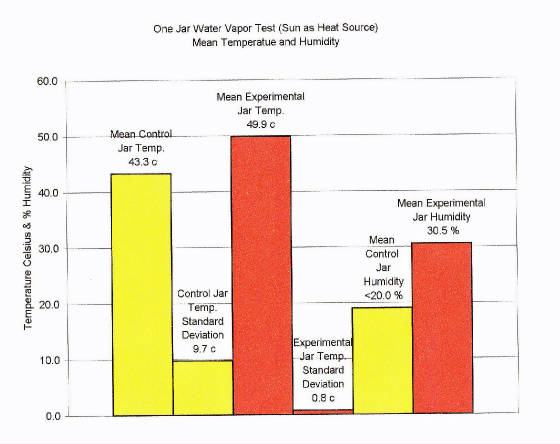
One Jar Water Vapor Experiment |
| |
|
Temp. |
|
shot glass of water and wet wrag |
| Min. |
Temp. |
Celsius |
Humidity |
|
|
|
| 0 |
21.3 |
21.3 |
< 20% |
|
Mean Total |
|
| 5 |
34.2 |
18.5 |
< 20% |
|
|
|
| 10 |
35.9 |
19.2 |
< 20% |
|
|
Standard |
| 15 |
36.5 |
20.0 |
< 20% |
|
|
Deviation |
| 20 |
40.3 |
21.1 |
< 20% |
Jar Temp. |
46.5 |
7.5 |
| 25 |
45.9 |
22.3 |
< 20% |
Ambient |
23.0 |
1.8 |
| 30 |
49.1 |
22.7 |
< 20% |
Humidity |
25.3 |
7.9 |
| 35 |
49.8 |
23.0 |
< 20% |
|
|
|
| 40 |
51.7 |
23.8 |
< 20% |
|
Mean Control |
|
| 45 |
51.7 |
22.8 |
< 20% |
|
|
|
| 50 |
51.5 |
22.3 |
< 20% |
|
|
Standard |
| 55 |
51.5 |
22.9 |
< 20% |
|
|
Deviation |
| 1 hr* |
50.5 |
22.8 |
< 20% |
Jar Temp. |
43.3 |
9.7 |
| 5 |
50.5 |
23.5 |
22 |
Ambient |
21.7 |
1.7 |
| 10 |
50.5 |
24.7 |
26 |
Humidity |
< 20% |
0.0 |
| 15 |
49.8 |
23.6 |
29 |
|
|
|
| 20 |
48.8 |
24.2 |
31 |
|
Mean Variable |
|
| 25 |
49.1 |
24.6 |
32 |
|
|
|
| 30 |
49.8 |
24.0 |
33 |
|
|
Standard |
| 35 |
49.8 |
24.7 |
34 |
|
|
Deviation |
| 40 |
49.1 |
24.7 |
35 |
Jar Temp. |
49.9 |
0.8 |
| 45 |
49.8 |
25.0 |
37 |
Ambient |
24.1 |
0.7 |
| 50 |
49.8 |
24.5 |
39 |
Humidity |
30.5 |
7.2 |
| 55 |
49.1 |
24.7 |
41 |
*Added water |
|
|
|
|
|
|
|
|
|
|
| Time |
Ambient |
Control |
Control |
Variable |
Variable |
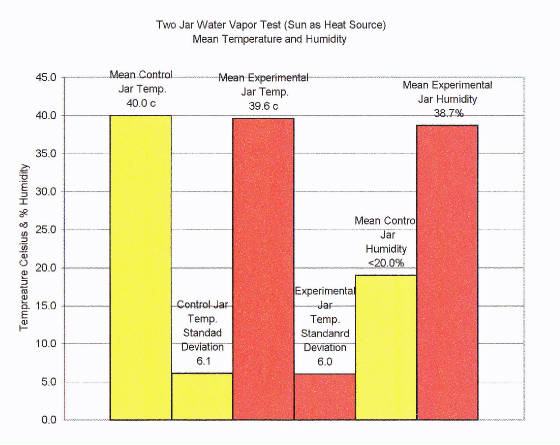
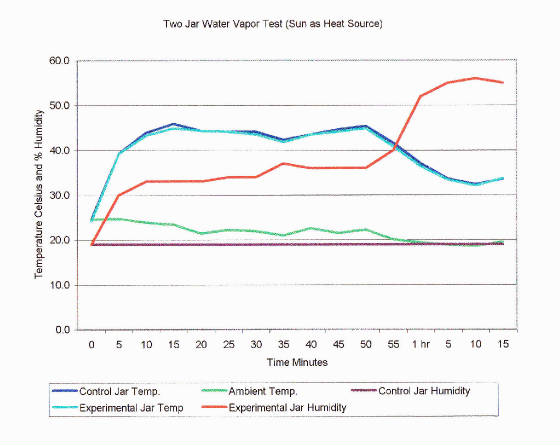
Two Jar Water Vapor Experiment |
| |
Temp. |
Jar |
Jar |
Jar |
Jar |
shot glass of water and wet rag |
|
|
| Min. |
Celsius |
Temp C. |
Humidity |
Temp C. |
Humidity |
|
|
|
| 0 |
24.6 |
24.6 |
< 20% |
24.2 |
< 20% |
|
Mean Control |
|
| 5 |
24.7 |
39.2 |
< 20% |
39.2 |
30 |
|
|
|
| 10 |
23.9 |
43.9 |
< 20% |
43.3 |
33 |
|
|
Standard |
| 15 |
23.4 |
45.9 |
< 20% |
44.9 |
33 |
|
|
Deviation |
| 20 |
21.4 |
44.3 |
< 20% |
44.3 |
33 |
Jar Temp. |
40.0 |
6.1 |
| 25 |
22.3 |
44.1 |
< 20% |
44.1 |
34 |
Ambient |
21.6 |
2.0 |
| 30 |
21.9 |
44.1 |
< 20% |
43.5 |
34 |
Humidity |
<20% |
0.0 |
| 35 |
21.0 |
42.3 |
< 20% |
41.8 |
37 |
|
|
|
| 40 |
22.6 |
43.5 |
< 20% |
43.5 |
36 |
|
Mean Variable |
|
| 45 |
21.5 |
44.6 |
< 20% |
44.1 |
36 |
|
|
|
| 50 |
22.3 |
45.4 |
< 20% |
44.9 |
36 |
|
|
Standard |
| 55 |
20.1 |
41.6 |
< 20% |
40.8 |
40 |
|
|
Deviation |
| 1 hr |
19.4 |
37.0 |
< 20% |
36.4 |
52 |
Jar Temp. |
39.6 |
6.0 |
| 5 |
18.9 |
33.6 |
< 20% |
33.4 |
55 |
Ambient |
21.6 |
2.0 |
| 10 |
18.6 |
32.4 |
< 20% |
32.1 |
56 |
Humidity |
38.7 |
10.5 |
| 15 |
19.5 |
33.6 |
< 20% |
33.7 |
55 |
|
|
|
| T-Test confidence level 99% |
T-Test confidence level 99% |
|
| The mean temperature of both |
The mean humidity of both |
|
|
| jars was not significantly |
|
jars was significantly |
|
|
| different |
|
|
different |
|
|
|
|
| Time |
Ambient |
Control |
Control |
Variable |
Variable |
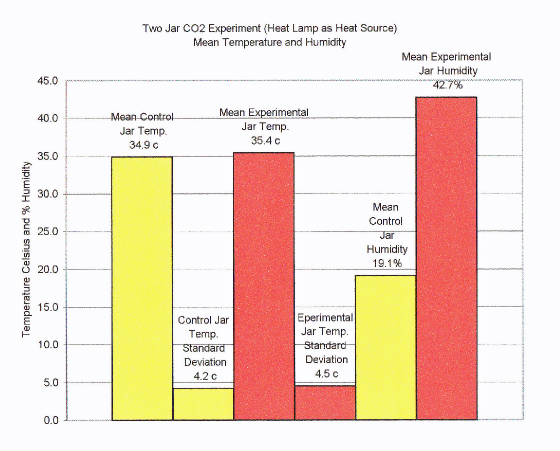
Two Jar CO2 Experiment |
|
| |
Temp. |
Jar |
Jar |
Jar |
Jar |
2 tbs vinegar |
|
|
| Min. |
Celsius |
Temp C |
Humidity |
Temp C |
Humidity |
1 ts baking powder |
|
|
| 0 |
18.9 |
19.3 |
22 |
18.9 |
20.0 |
|
Mean Control |
|
| 5 |
18.1 |
25.3 |
< 20% |
25.3 |
24.0 |
|
|
Standard |
| 10 |
18.2 |
27.4 |
< 20% |
27.6 |
30.0 |
|
|
Deviation |
| 15 |
18.3 |
29.8 |
< 20% |
30.1 |
30.0 |
Jar Temp. |
34.9 |
4.2 |
| 20 |
18.1 |
32.0 |
< 20% |
32.1 |
33.0 |
Ambient |
18.9 |
1.1 |
| 25 |
18.1 |
33.2 |
< 20% |
33.9 |
35.0 |
Humidity |
<20% |
0.5 |
| 30 |
17.9 |
34.7 |
< 20% |
34.9 |
36.0 |
|
|
|
| 35 |
17.5 |
35.5 |
< 20% |
35.6 |
37.0 |
|
|
|
| 40 |
17.7 |
35.8 |
< 20% |
36.3 |
38.0 |
|
Mean Variable |
|
| 45 |
19.4 |
35.9 |
< 20% |
36.3 |
39.0 |
|
|
|
| 50 |
20.3 |
36.3 |
< 20% |
37.0 |
40.0 |
|
|
Standard |
| 55 |
18.7 |
36.5 |
< 20% |
37.3 |
40.0 |
|
|
Deviation |
| 1 hr |
18.1 |
36.9 |
< 20% |
38.0 |
40.0 |
Jar Temp. |
35.4 |
4.5 |
| 5 |
18.0 |
36.9 |
< 20% |
38.0 |
41.0 |
Ambient |
18.9 |
1.1 |
| 10* |
18.2 |
37.2 |
< 20% |
38.0 |
41.0 |
Humidity |
42.7 |
9.7 |
| 15 |
18.2 |
37.2 |
< 20% |
37.6 |
41.0 |
|
|
|
| 20 |
18.3 |
36.9 |
< 20% |
38.1 |
43.0 |
|
|
|
| 25 |
18.3 |
36.5 |
< 20% |
38.9 |
46.0 |
|
|
|
| 30 |
19.4 |
36.3 |
< 20% |
38.9 |
48.0 |
|
|
|
| 35 |
20.9 |
36.5 |
< 20% |
38.3 |
48.0 |
|
|
|
| 40 |
21.3 |
36.9 |
< 20% |
37.8 |
50.0 |
|
|
|
| 45 |
18.8 |
37.0 |
< 20% |
37.8 |
51.0 |
T-Test confidence level 99% |
| 50 |
18.7 |
37.2 |
< 20% |
38.1 |
51.0 |
The mean temperature of both |
| 55 |
18.6 |
37.4 |
< 20% |
38.5 |
51.0 |
jars was not
significantly |
|
| 2 hr |
18.5 |
36.7 |
< 20% |
37.5 |
52.0 |
different |
|
|
| 5 |
18.6 |
37.6 |
< 20% |
37.0 |
54.0 |
|
|
|
| 10 |
18.6 |
37.6 |
< 20% |
36.7 |
55.0 |
T-Test confidence level 99% |
| 15 |
19.3 |
36.3 |
< 20% |
35.9 |
56.0 |
The mean humidity of both |
| 20 |
20.7 |
36.5 |
< 20% |
36.3 |
56.0 |
jars was significantly |
|
| 25^ |
21.4 |
36.9 |
< 20% |
36.3 |
56.0 |
different |
|
|
| 30 |
19.0 |
32.7 |
< 20% |
33.1 |
56.0 |
|
|
|
| 35 |
18.9 |
30.3 |
< 20% |
30.7 |
64.0 |
|
|
|
| 40 |
19.1 |
27.9 |
< 20% |
28.6 |
70.0 |
|
|
|
| 50 |
19.1 |
26.6 |
< 20% |
27.1 |
72.0 |
* Added more CO2 |
|
| 55 |
18.8 |
25.5 |
< 20% |
26.1 |
74.0 |
^ Turned heat off |
|
| Time |
Jar |
Ambient |
Jar |
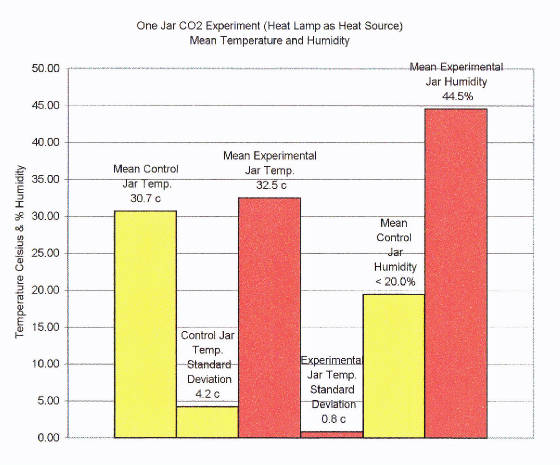
One Jar CO2 Experiment |
|
| |
|
Temp. |
|
2 tbs spoon vinegar |
|
| Min. |
Temp. |
Celsius |
Humidity |
1 ts spoon baking soda |
|
|
| 0 |
21.1 |
20.7 |
22 |
|
Mean Total |
|
| 5 |
24.7 |
19.9 |
22 |
|
|
|
| 10 |
26.9 |
19.7 |
< 20% |
|
|
Standard |
| 15 |
28.9 |
19.2 |
< 20% |
|
|
Deviation |
| 20 |
30.3 |
19.1 |
< 20% |
Jar Temp. |
33.2 |
4.0 |
| 25 |
31.5 |
18.9 |
< 20% |
Ambient |
19.9 |
7.2 |
| 30 |
32.6 |
18.8 |
< 20% |
Humidity |
35.5 |
15.2 |
| 35 |
33.0 |
18.8 |
< 20% |
|
|
|
| 40 |
33.5 |
19.8 |
< 20% |
|
Mean Control |
|
| 45 |
33.8 |
20.9 |
< 20% |
|
|
|
| 50 |
34.1 |
21.2 |
< 20% |
|
|
Standard |
| 55 |
34.2 |
19.9 |
< 20% |
|
|
Deviation |
| 1 hr* |
34.5 |
19.5 |
< 20% |
Jar Temp. |
30.7 |
4.2 |
| 5 |
34.5 |
19.9 |
20 |
Ambient |
19.8 |
0.8 |
| 10 |
34.8 |
20.0 |
40 |
Humidity |
< 20% |
1.1 |
| 15 |
35.5 |
19.5 |
45 |
|
|
|
| 20 |
35.8 |
19.6 |
47 |
|
Mean Variable |
|
| 25 |
35.6 |
20.7 |
49 |
|
|
|
| 30 |
35.9 |
20.9 |
51 |
|
|
Standard |
| 35 |
36.3 |
20.9 |
50 |
|
|
Deviation |
| 40 |
36.5 |
19.7 |
51 |
Jar Temp. |
35.8 |
0.8 |
| 45 |
36.5 |
19.4 |
51 |
Ambient |
20.0 |
0.6 |
| 50 |
36.5 |
19.3 |
52 |
Humidity |
44.5 |
7.2 |
| 55 |
36.5 |
19.5 |
52 |
|
|
|
| 2 hr |
36.9 |
20.7 |
52 |
*Added CO2 |
|
|